By constructing a verification problem I gained a greater understanding of the way in which trig functions work, and how to simplify them.
|
By constructing a verification problem I gained a greater understanding of the way in which trig functions work, and how to simplify them.
0 Comments
In this activity I learned a greater understanding of how trig functions work, and how to graph them on a coordinate plane. Before this activity I didn't understand this concept very well, but now I believe I have a full grasp of the concept. I'm a visual learner so this helped me immensely.
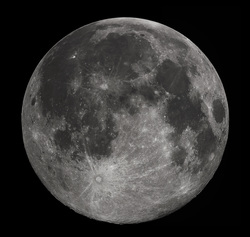 The distance from the earth to the moon is approximately 238,900 miles or 15,133,468,504 inches. If your average sheet of printer paper is 0.005 inches thick. using the formula 0.005(2^x) which calculates the thickness in inches of a folded sheet of paper, we find that you would need to fold the piece of paper 42 times to achieve this distance. This is of course, impossible. Paper will not fold at all past about 8 folds due the thickness of the paper. The actual distance would be longer than that to get to the moon, but 41 folds would leave the paper too "short" to reach the moon. The total distance at the end of the folding is 21,990,232,556 inches. Using the exponential decay function y=100(2^x) (where x equals 42) we can determine that the paper is 0.0000000000227374% of its original width and length. This means that the width of the folded paper is 0.0000000001932679 inches, and the length is 0.0000000002501114 inches. This is of course, impossible. Paper will not fold at all past about 8 folds due the thickness of the paper.
Even and odd functions both have a certain level of symmetry. the main difference is that even functions have a very distinct line of symmetry across the Y-axis and odd functions reflect on both axis. Both functions otherwise have very similar properties in composition and are very intriguing to play around with in desmos.
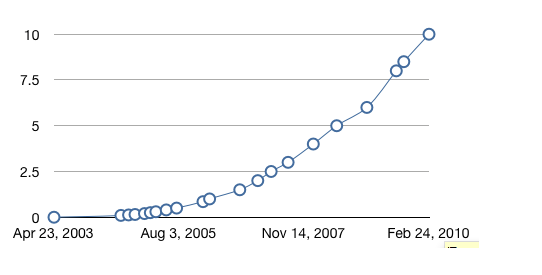 the function shown appears to be exponential. The Domain is x >0 The Range is y>=0 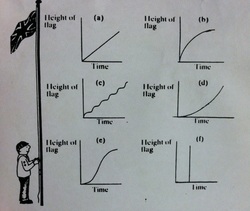 A: in a, the graph indicates that the flag ascends at a constant speed over time.
B: in b, the graph indicates that the flag ascends very quickly, and slows down near the end. C: c states that the flag ascends in short burst of speed. slowing down, and then accelerating again. D: d shows that the flag ascends slowly, and accelerates as it climbs E: e ascends slowly like d, and speeds up, but slows down near the end like b F: in f, the flag exists at all point along the flagpole in the same instant of time. I believe C is more accurate. As the flag is being hoisted, the scout must re-position his arms to continue pulling the rope known as a halliard. this means the flag will move, stop, and move again; repeating this pattern until it reaches the top of the pole. Although this is the case according to this diagram, the traditional method by which a scout raises a flag consists of two members of the color guard each alternating pulls to create a graph much closer to "A" 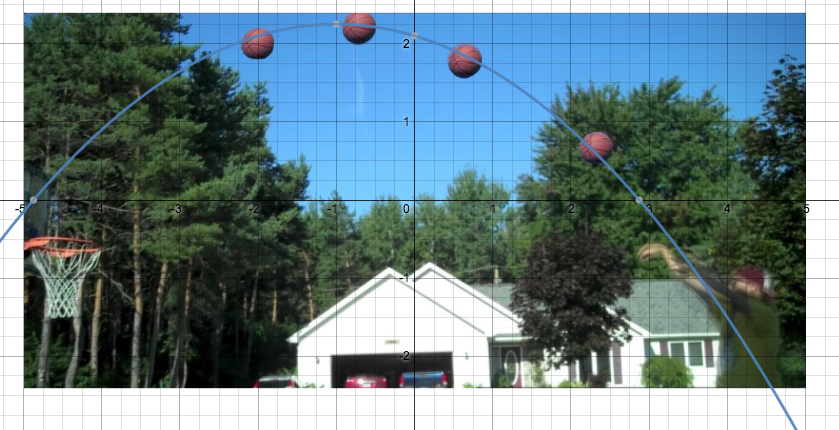 the function I used to graph the arc of the basketball is f(x)= -.15x^2-.3x+2.1 from this I have determined the most likely occurrence is that the basketball will bounce off the backboard and into the hoop.
A. How close was your prediction to the actual graph? If you're graphs were different then why were they different? What initial reasoning led you to your original graph and why was it different?
My predictions were usually way off, correctly predicting the start and end points, but then shaped entirely differently. I believe the speed of the skateboard would be exponential in nature, but it proved much more erratic. B. What do the zeros of your graph represent? They represent the times in which the skateboard was not moving anymore, and had reached the bottom of the driveway. C. How do the three graphs compare in terms of zeros, maximums and minimums? What's similar and different and why? The smaller the ramp was, the lower the maximum, and the sooner the zero occurred. D. Consider the slopes of the graphs. When is the graph rising the fastest and what does it mean? When is it falling the fastest and what does it mean? The graph rises fastest early on, and falls fastest near the end. This means that the skateboard is decelerating up the driveway, and begins to accelerate as it heads down the driveway. |
Daniel CassavaughArchives
November 2015
Categories |
 RSS Feed
